The Dutch Disposable Income Trap: Why ‘Normal’ Spending Power Is a Dangerous Fantasy
The question seems simple enough: how much disposable income should you have left after paying all your fixed costs? But in the Netherlands, this straightforward query triggers a cascade of financial anxiety, defensive justifications, and existential budget crises. When someone asks what’s “normal” to have left each week, they’re not just seeking a number—they’re trying to validate their own financial survival in one of Europe’s most peculiar economic landscapes.
The Comparison Trap: Why “Normal” Is Financially Meaningless
The moment you try to compare disposable income across Dutch households, you’ve already lost. One family might have €750 left monthly after all expenses, while another struggles with €200. But those numbers exist in completely different economic universes.
Consider the variables: some households carry a modest hypotheek (mortgage) from the 2010s, while others face current market rates that consume half their net income. Some count boodschappen (groceries) as fixed costs, others treat them as flexible spending. The couple with two lease cars and a weekend Corvette C6 has consciously traded cash flow for “smiles per mile”, while their neighbors funnel every spare euro into index funds.
Fixed Costs That Devour Your Income
The Housing Monster
Your biggest expense isn’t negotiable, and it’s currently crushing spending power nationwide. In 2025, the Netherlands faces a statistical woningtekort (housing shortage) of 396,000 homes. With 8.462 million households competing for just 38,000 available properties, the pressure on housing costs is extreme.
This shortage means that if you secured your woning (home) before 2020, your housing costs might be manageable. If you’re searching now, you’re likely paying 30-40% above what someone in an identical property paid just five years ago. That difference alone can erase €500-800 of monthly disposable income before you even think about groceries.
Gemeentelijke Belastingen: The Stealth Budget Killer
While you’re calculating rent or hypotheek payments, gemeentelijke belastingen (municipal taxes) quietly drain another €622 to €1,467 annually depending on your location. The average household now pays €1,001 per year, a 3.9% increase from 2025.
The gap between highest and lowest is staggering. Residents in Rozendaal (Gelderland) fork over €1,467.35, while those in Rijssen-Holten pay just €622.70. That’s an €844 difference, enough to fund a modest weekend trip or cover three months of energy bills. These taxes fund local voorzieningen (facilities) like waste collection and dike maintenance, but they’re also a stark reminder that your postal code directly impacts your spending power.
Energy Costs: The Volatile Variable
Energy prices have become the ultimate budget disruptor. Current stroomprijzen (electricity prices) average €0.26 per kWh, but this figure masks wild fluctuations. A two-person household using 2,500 kWh annually faces €650+ in electricity costs alone, before gas.
The energy market’s sensitivity to geopolitical events means your monthly costs can jump €36 in a single week, as happened recently due to Middle East tensions. For households on variable contracts, this volatility turns budgeting into guesswork. Even with the €628.96 energiebelasting vermindering (energy tax reduction) in 2026, many families find their energy bills 20-30% higher than two years ago.
Lifestyle Inflation: The Choice Between Surviving and Living
“Ik heb bijvoorbeeld een leukere auto dan nodig, gigabit internet, onbeperkt alles mobiel x2, kachel net iets te hoog en net te veel streaming diensten.”
This is leefstijlinflatie (lifestyle inflation) in action. The choice between a Kia Ceed and an RS6 isn’t just about transportation—it’s about identity, comfort, and the psychological trade-off between financial optimization and daily satisfaction. That “net iets leukere auto” (slightly nicer car) might cost €300 more monthly in lease and fuel, but for some, the daily driving experience justifies the reduction in disposable cash.
The same logic applies to housing. Many Dutch families consciously choose larger homes in child-friendly neighborhoods, accepting that their vaste lasten (fixed costs) will consume 60-70% of income. They’re not failing at budgeting—they’re prioritizing space over spending money.
Regional Variations: Geography Is Destiny
Your province determines more than just your accent—it shapes your essential costs significantly.
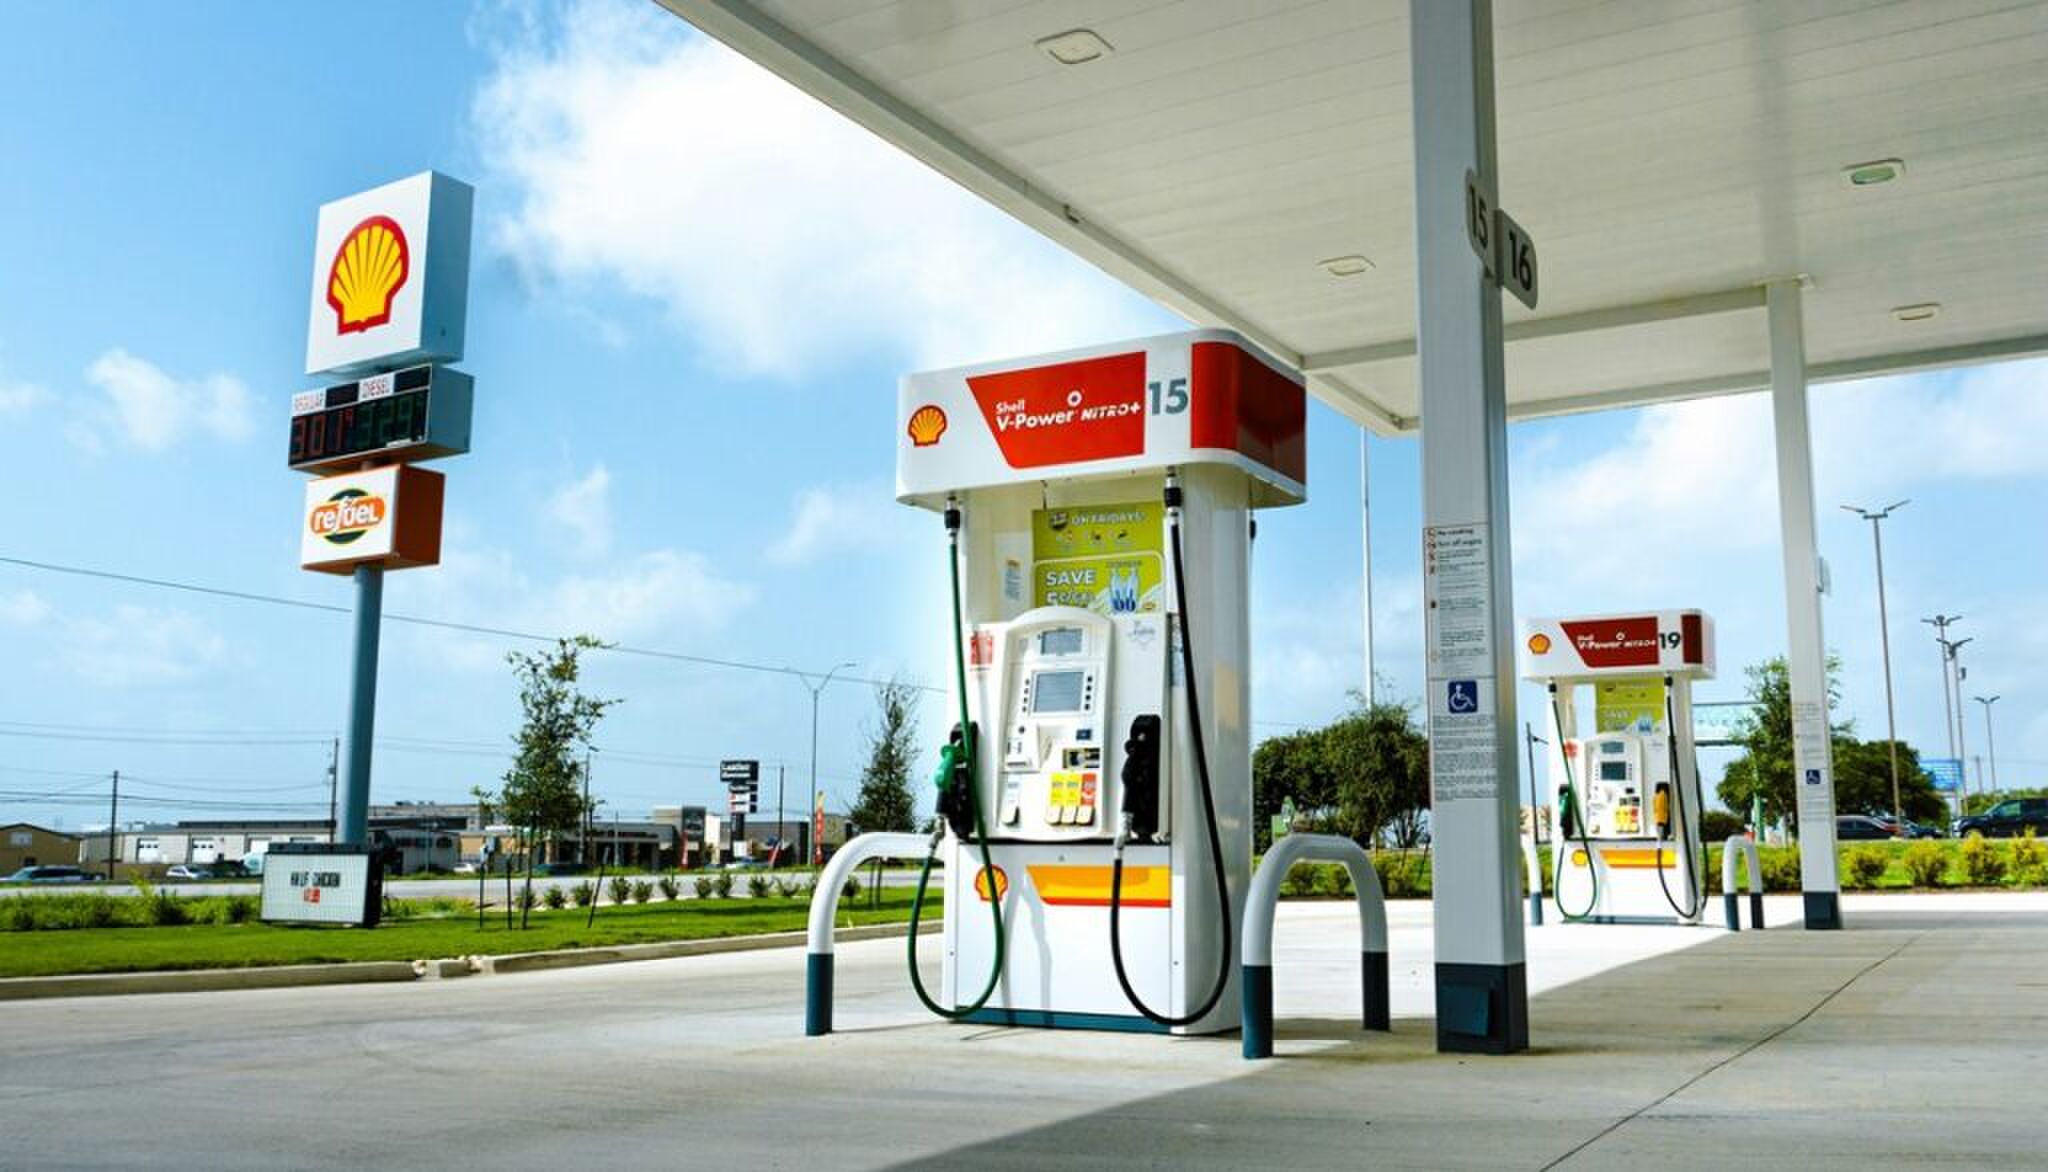
Fuel Prices
Vary by up to €0.53 per liter between provinces. The cheapest stations in Drenthe, Overijssel, and Zeeland charge €1.889, while Utrecht’s best offer is €1.959. For a family driving 20,000 km annually in a car consuming 7L/100km, that’s a €74 difference, purely based on where you live.
Municipal Taxes
show even starker divides. The €844 gap between cheapest and most expensive municipalities represents a week’s net salary for many median earners.
Housing Costs
Swing wildly. Amsterdam’s city center averages €1,362 monthly for a one-bedroom apartment, while Almelo offers similar space for €804. That’s €558 monthly, enough to fund a serious hobby or accelerate savings.
The Savings Paradox: Zero-Based Budgeting vs. Leftover Logic
Many financially successful Dutch households reject the entire concept of “disposable income.” Instead, they use zero-based budgeting where every euro has a purpose before the month begins.
One household reported: “Wij maken een zero based budget dus in onze budgettering zorgen we dat elke euro een bestemming heeft.” Their €250 monthly “zakgeld” (pocket money) per adult covers unbudgeted expenses, while 15% of income goes directly to savings.
This approach inverts the typical question. Instead of asking “how much is left?” they ask “what should this euro do?” Unspent budget money doesn’t roll into frivolous spending—it gets reallocated to savings or debt payoff.
This mindset shift explains why some households report having “nothing left” yet maintain healthy investment accounts and emergency funds. They’re not broke—they’re deliberate.
What Realistic Numbers Actually Look Like
Let’s ground this in reality with a concrete example for a median Dutch household:
- Net monthly income: €3,500 (two earners)
- Fixed costs:
- – Hypotheek or rent: €1,400 (40% of income)
- – Gemeentelijke belastingen: €83 (€1,001 annually)
- – Energy: €180 (gas + electricity)
- – Insurance (zorgverzekering + others): €250
- – Mobile/internet: €80
- – Boodschappen: €600
- – Car (lease/loan + fuel + insurance): €400
- – Childcare (kinderopvang): €300 (if applicable)
Total fixed: ~€3,293
“Disposable” income: €207
This household has €207 monthly, about €48 weekly, for clothing, entertainment, unexpected costs, and savings. Yet this is completely normal for a median-earning family with children.
A dual-income household without children might have €800-1,000 left, while a single person in social housing could have €1,200+. The range is enormous—but none of these situations is “wrong.”